
Air Quality Monitor using PMS7003, BME688 and Raspberry Pi Zero
After recently purchasing an HEPA Air Purifier I decided it would be an interesting project to read and log air quality in my home.
The original Raspberry Pi Zero W I had spare which is a fairly low power computer by modern standards, but it's got enough resources to read sensors, log the results to the database and expose the results via a web page (and API). It's a decent choice for this project.
After some research, the sensors I would buy for this project are the PMS7003 by PLANTOWER, which can read PM1.0, PM2.5 and PM10 particle density in µg/m³ and the BME688 sensor from Bosch Sensortec to measure gas, pressure, temperature and humidity. I did initially start with the AHT25 for temperature and humidity, but results were poor.
The two sensors and the conveniently small Pi Zero fits in a cheap project box measuring 10cm x 6cm x 2.5cm. No screen is present because I'm nearly always close to one in my own home (PC, laptop, Smartphone) which do excellent jobs of displaying a webpage. There's also no buttons or LEDs - the interaction is purely web based.
Being web based, this allows me to set up the UI as I wish, and I used the open source chart.js for graphing the results, and influxdb as the database (as measurements are timestamped). As I run my own home based VPN too, I can even connect from (almost) anywhere in the world with Internet access and monitor my home air quality, if I wish!
Python code runs as a service to read the sensor data and write to the database. This runs independently of separate Python code which exposes a simple web framework that reads and displays values.
So, here is my implementation:
About Air Quality
My interest from this came about when reading news articles about air quality and how poor it can be in cities especially and impact your health. I'd also caught a few comments recommending a HEPA air purifier as a life changing purchase.
So, I did. But the purifier doesn't tell you the quality of the air, so I started to look at ways to monitor it to see how bad my indoor air quality really is. In particular interest is the Particulate Matter (PM), with some governments taking an interest in reading PM10 and PM2.5 based on the latest evidence on the effects to health.
For PM10, a 24 hour average of 50 µg/m³ is considered moderate by the UK. For PM2.5, it's 35µg/m³ average over 24 hours.
PM10 can include dust and dirt, smoke, combustion, pollen and mould. You might be able to smell these things, but sometimes not. It's less likely than PM2.5 to enter the bloodstream through your lungs, however, it can cause irritation to eyes, nose and throat and long term exposure can affect lungs (lung cancer) and heart.
PM2.5 is more dangerous to health as it is more easily absorbed through the lungs and into your blood. Lung damage can cause respiratory illnesses such as asthma, bronchitis, and emphysema. Blood gets pumped around your body through the heart (leading to cardiovascular problems) and also reaches the brain (stroke, amongst other bad effects). PM2.5 can include dust, soot, smoke (inc. smoking), combustion emissions (i.e., from engines, vehicle or otherwise), construction and demolition and even organic sources such as soil.
Other than PM, bad pollutants also involve (but not limited to) Nitrogen dioxide (NO2), Ozone (O3), Carbon monoxide (CO), Sulphur Dioxide (SO2), Lead (Pb) and Formaldehyde from Volatile Organic Compounds (VOCs). These also can cause a number of serious health issues.
Hardware
Below is the hardware I'd use for the project:
- Raspberry Pi Zero W - the brains of the operation, a cheap ARM computer developed here in the UK, but has become extremely popular. I need the 'W' version with wireless so I can access the data remotely. Designed to run Linux (and I'll use the default Raspberry Pi OS OS distro). Requires a separate Micro SD card.
- PMS7003 Particle Sensor - (aka PMSA003A) a sensor that uses a fan and laser to measure suspended small particles in the air. This will measure the PM10, PM2.5 and PM1.0 in the air, in µg/m³.
- BME688 gas, pressure, temperature & humidity sensor (Pimoroni module) - for measuring temperature, pressure and humidity, but can also be a 'digital nose' set up to react to changes in Volatile Organic Compounds (VOCs), Volatile Sulphur Compounds (VSCs) and the presence of Carbon Monoxide and Hydrogen.
- USB Power Supply - 5V 2A or better.
- Homemade PCB for mounting the PMS7003 connector (separate adapters can be purchased if you want to avoid PCB etching)
- 2.54mm headers for Pi, 'Dupont' connectors and housings (best get a kit), cable, PCB, nylon screws, nuts.
- Project case to house it all.
There is no screen, buttons or battery. It is viewed on a PC or Smartphone and is designed to run continuously to log data.
The sensors are the greatest expense for the project, followed by the Pi. The rest of the hardware shouldn't add much to the cost.
The below wiring diagram is how the hardware is connected together:
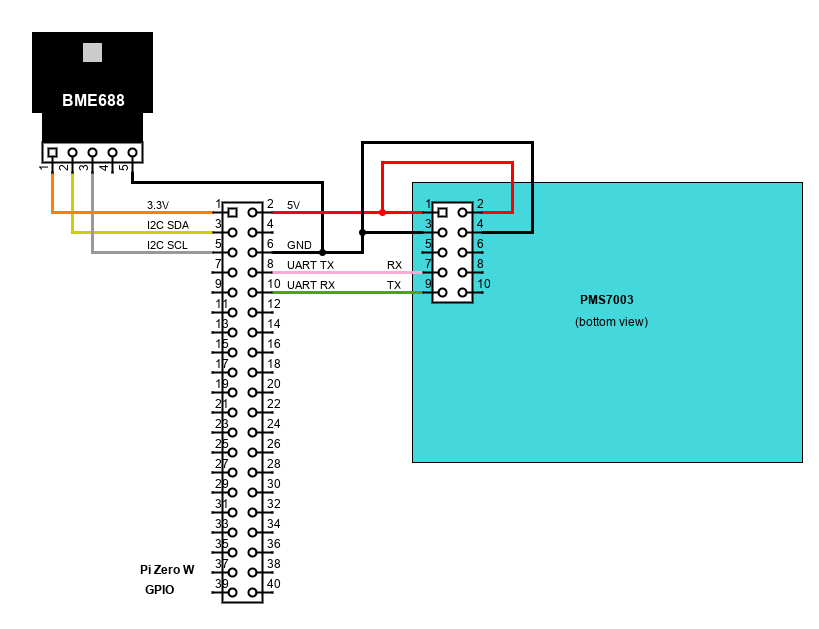
Wiring is simple. Only the sensors are connected via the power, UART and I2C headers of the Pi. The Pi receives its power via the micro USB port connected to a 5V phone charger.
The complication was the header for the PMS7003 is Samtec TFC/TMF header with 1.27mm (0.05 inch) spacing instead of the usual 2.54mm (0.1 inch) spacing, making it incompatible with any of my typical headers. A PCB mount header comes with the sensor but it would be awkward to solder directly to. This drove me to make and etch my own PCB with offcuts of copper board I already had. It would allow me to adapt the PMS7003 connections via wires to standard 2.54mm DuPont headers for plugging into the Raspberry Pi. I also designed the board for the spacing of the AHT25 sensor, which I later abandoned for the much better (separate) BME688 board.
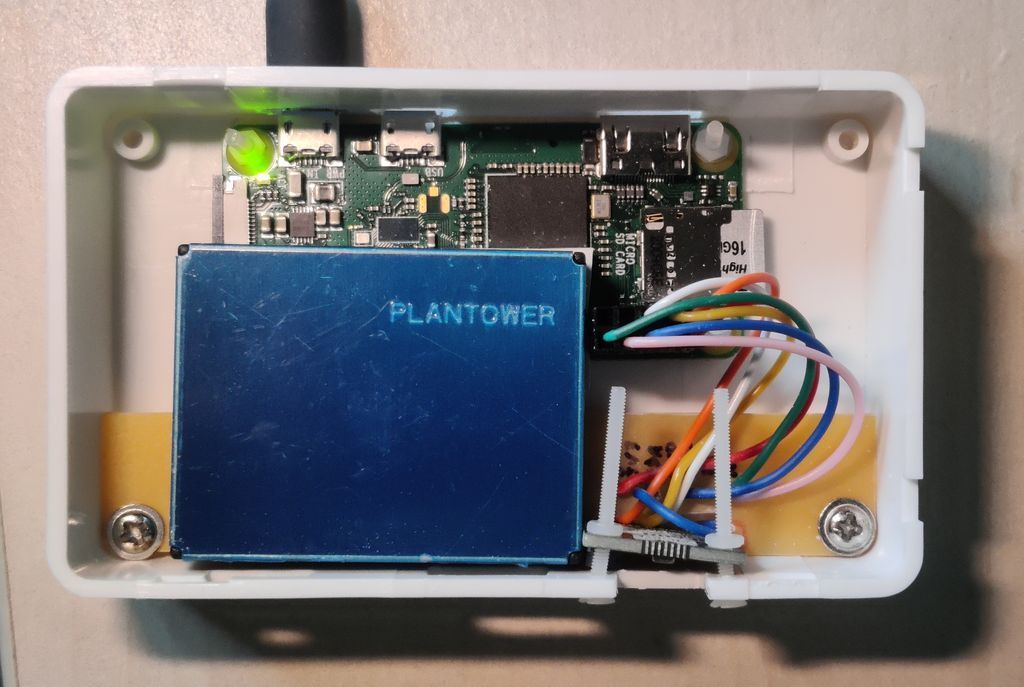
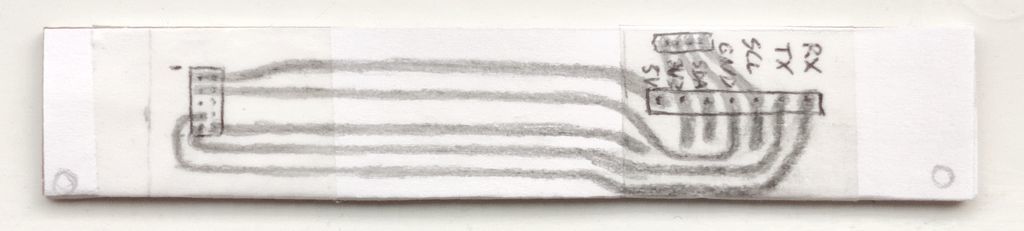
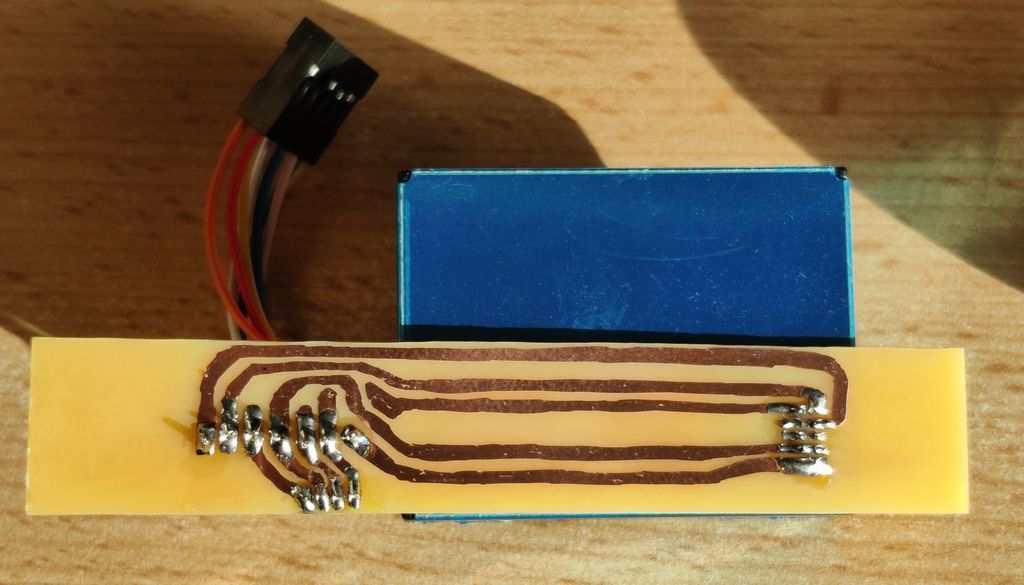
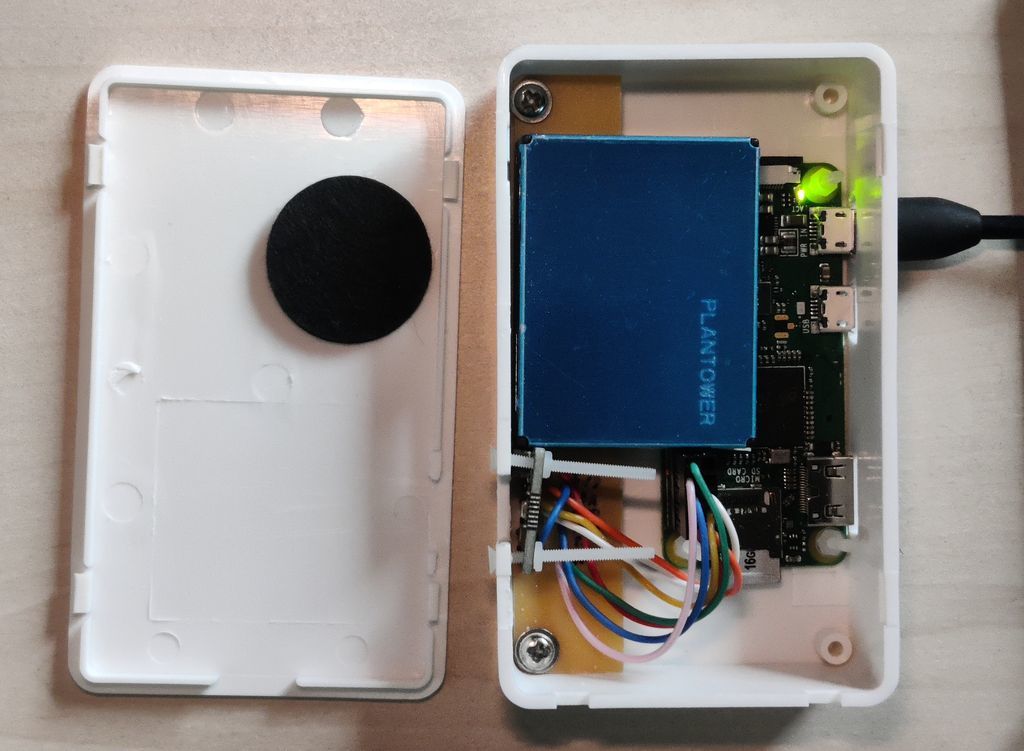
Below is a picture of my layout, as well as the PCB. These images will not be true size. The PCB was built for the AHT25, so how the BME688 sensor board is placed is an after-thought that shows! Get the sensor as exposed as possible (whilst still being protected from accidents).

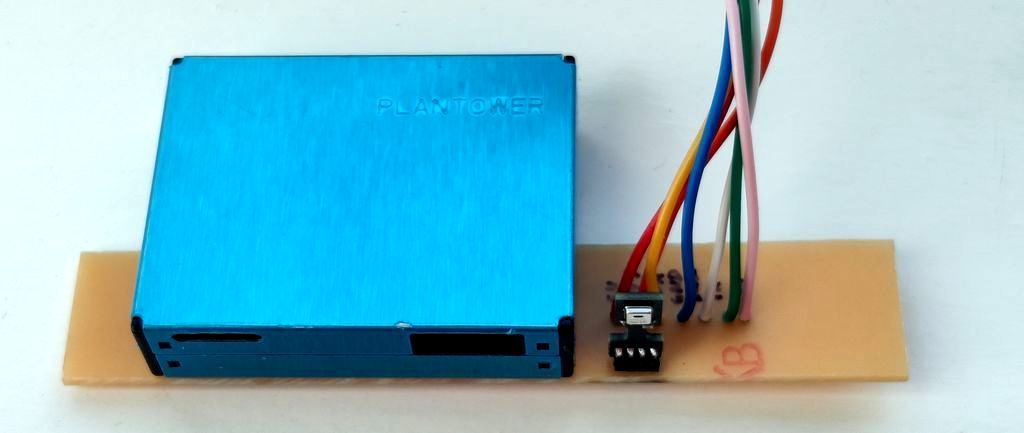
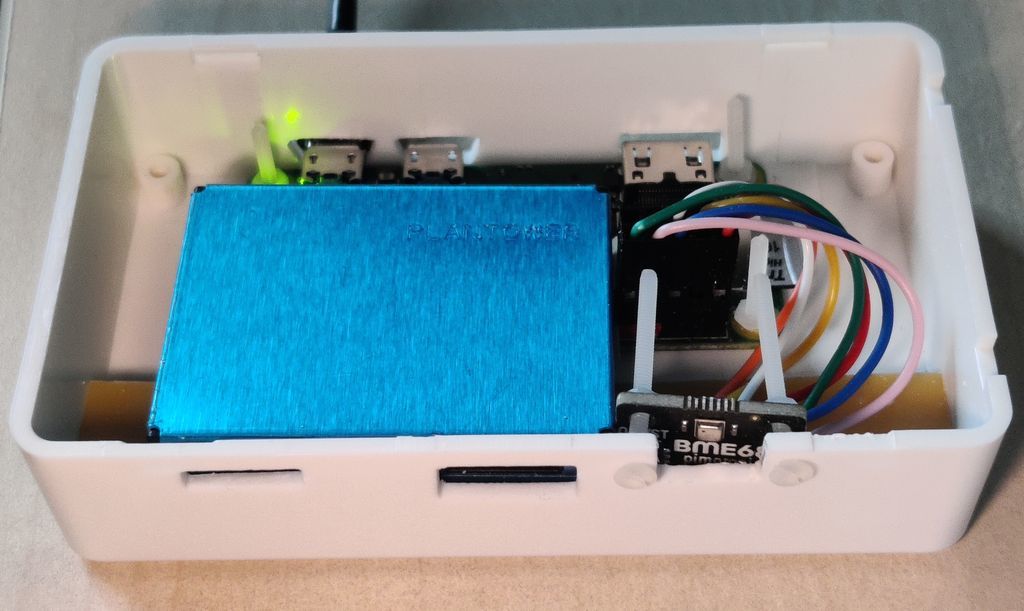
Below is a picture of the built layout including case lid which has gentle padding to keep PMS7003 in place. Note that the Pi Zero slides under the PMS7003 in this case / layout so don't order the Pi with soldered GPIO headers if you plan on doing the same!
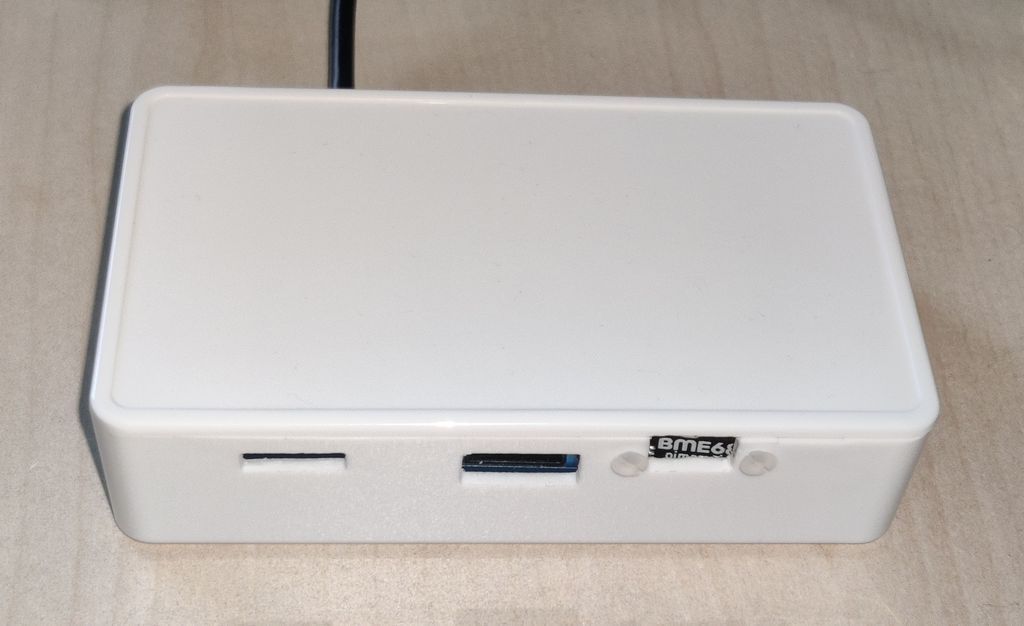
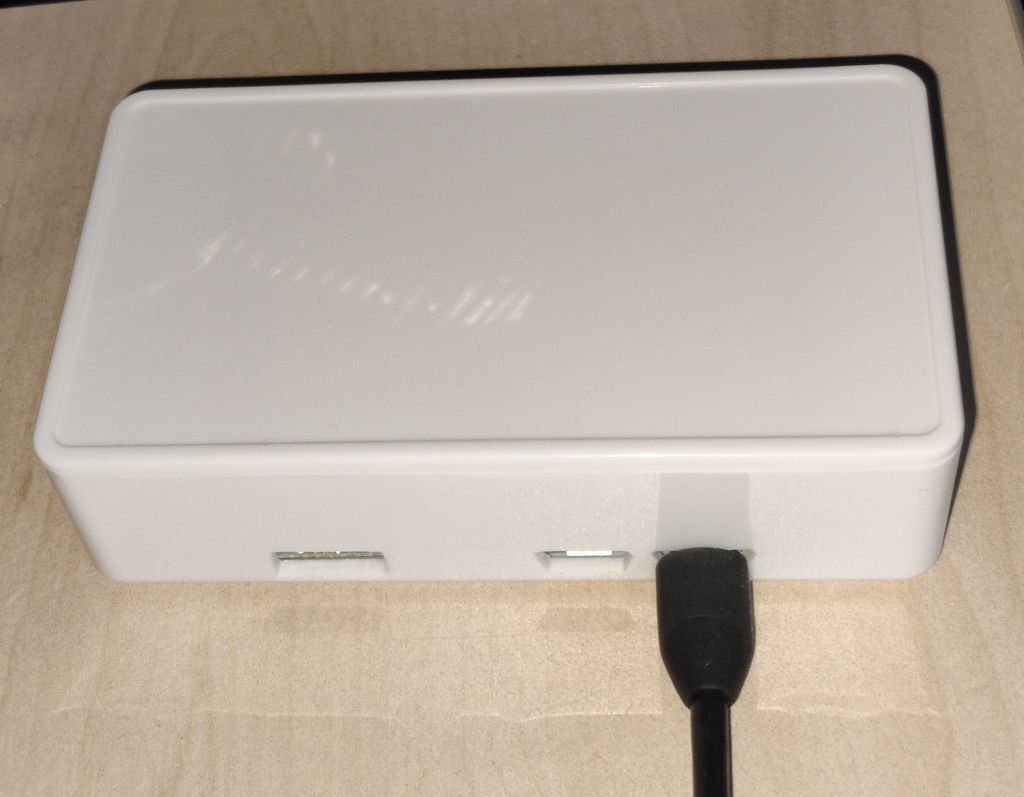
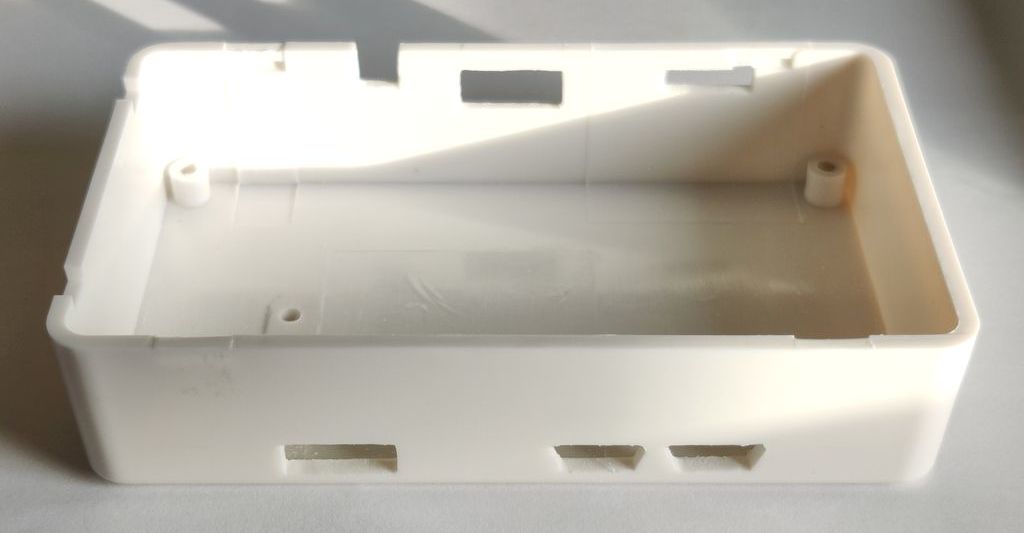
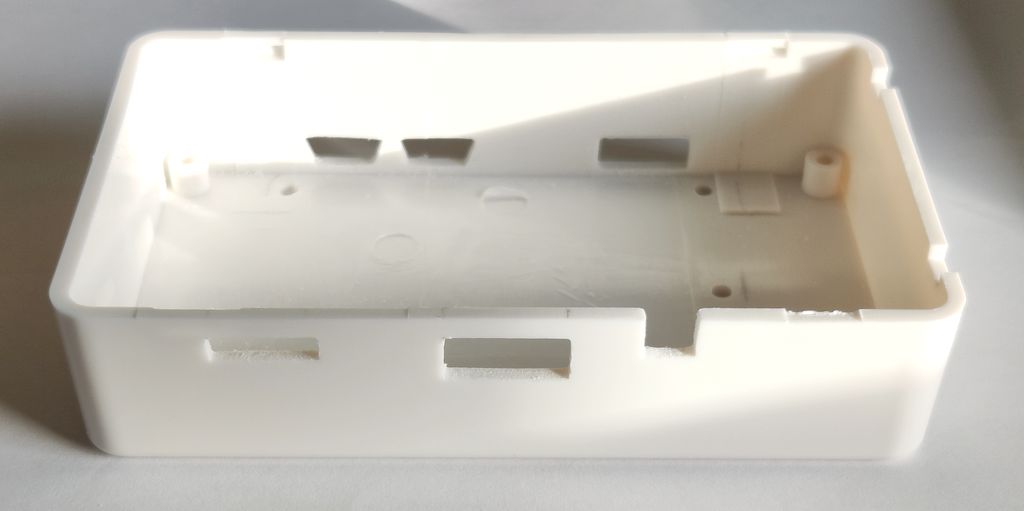
Adjusting the case took a little time, but it was done purely with cheap tools - drill and drill bits + needle files. The first picture is the openings for the Pi ports (even though two I've never used), the second is the sensor openings.
Software
▷ My files file downloading / clone are available at github.com.
Operating System (OS)
![]()
For the OS, I'm using the standard Raspberry Pi OS Lite 32-bit bullseye version. That's because the UI is web based, meaning no GUI is needed for the OS. Please see my Raspberry Pi OS Tweaks page for installation recommendation and tweaks.
After installing and updating, some initial configuration adjustments are required. We'll need to enable I2C for the BME688 and UART for the PMS7003. I've also disabled audio since it needs no speaker.
sudo nano /boot/config.txt
Add, change or uncomment the following options:
...
# Uncomment some or all of these to enable the optional hardware interfaces
dtparam=i2c_arm=on
...
# Enable audio (loads snd_bcm2835)
dtparam=audio=off
...
# Enable UART
enable_uart=1
To enable the i2c driver, we also need put i2c-dev into /etc/modules. To do this quickly, run:
sudo sh -c "echo i2c-dev >> /etc/modules"
Alternatively, I2C and UART can be enabled by running raspi-config.
We'll install git cmake gcc and g++ for building the projects we'll use:
sudo apt install -y git cmake gcc g++
Influx DB
For a small scale project like this, the choice of database isn't too critical, and I was considering using Maria DB (a fork of MySQL, which I've used about 17 years ago!). However, I did some research about time/sensor logging databases and found influxdb is a recommendation, so I decided to use that instead.
It is supported on the Pi, and the little computer has enough power to host the database for local read and write purposes which is all I need (it could suit remote purposes too but wouldn't be able to handle many clients).
Installing it is easy enough - head to https://www.influxdata.com/downloads/. At time of writing, I picked version InfluxDB v2.7.5 and platform is "Ubuntu & Debian" or "Ubuntu & Debian (ARM 64-bit)" - both options will grab the binaries for the older version 1.8.10 of InfluxDB for ARMv6 32-bit anyway as that's all the Pi will support.
The client for Python is also required:
sudo apt install python3-influxdb
Once we have the Python client, we should be able to run python3 and then run line-by-line statements to connect and create a database:
>>> from influxdb import InfluxDBClient
>>> client = InfluxDBClient(host='localhost', port=8086)
>>> client.create_database('airq')
>>> client.get_list_database()
[{'name': '_internal'}, {'name': 'airq'}]
>>> exit()
There's no need to create a 'table', because that's what a measurement is in influxdb. We'll write points to the DB after reading our sensors and influxdb will store them appropriately with a timestamp against them automatically.
PMS7003
The PMS7003 implementation is simple, and it took me less than an hour to get it up and running.
However, it's not recommended to keep the PMS7003 awake 24/7 and read it constantly. For a better lifespan, it should be put to sleep and woken up at infrequently intervals to read data.
The approach that helps the sensor's operational life is to:
- Wakes up the PMS7003 - this will cause its fan to start spinning
- Sleeps for 60 seconds - it is recommended to wait at least 30 seconds after waking up to get stable data
- Read the sensor - collecting measurements returned as a dictionary
- Puts the sensor to sleep again - this stops the fan spinning
I decided to do this every 15 minutes.
The python read service depends on pms7003.py which is from Tomasz Lewicki's code on github.com. It works nicely and I picked this code as it implemented the sleep and wakeup commands which I rely on.
BME688
The BME688 sensor also has libraries available. It's not out-of-the-box perfect however and for many measurements it needs to be 'trained'. Bosch Sensortec's BSEC software (closed source) allows for measuring the IAQ (Indoor Air Quality) with ability to train for specific gases.
I downloaded and used the older 2.0.6.1 version of BSEC. You can download it from Bosch Sensortec here. This is both compatible with the pi3g library and does not seem to have a 'business use only' license (the latest restricts private use).
The library is the pi3g bme68x-python-library (gihub.com). On the Pi itself, you can clone this by running:
cd ~
git clone https://github.com/pi3g/bme68x-python-library
Put the BSEC zip in the bme68x-python-library directory that is created and unzip it there (unzip bsec_2-0-6-1_generic_release_04302021.zip). The folder BSEC_2.0.6.1_Generic_Release_04302021 should be created inside bme68x-python-library. Then run:
cd ~/bme68x-python-library
sudo python3 setup.py install
Before using it in my project, I used the mcalisterkm - p-sensors code to create a burn-in configuration, which I'll use in my web service to improve calibration time.
cd ~
git clone https://github.com/mcalisterkm/p-sensors
You can run the burn in python code over the next 24 hours to create the conf files.
cd ~/p-sensors/src/1.3.0/BurnIn/
nohup python3 burn_in.py &
Use tail -f nohup.out to view and follow the output.
Wait 24 hours. During that time, put hand cleanser gel (60 / 70% alcohol) in front of sensor for a short while. After 24 hours, you'll get two new conf_ and state_ txt files in the conf subdirectory. Copy these to a conf folder in your Pi's home directory.
Sensor reading service
I split the tasks of reading data and viewing data into two separate independent pieces of code, deployed as systemd services.
This first one is used to read the sensors periodically. Regardless of whether I'm viewing the data, I want the results to be logged regularly so it makes sense to disconnect the reading process from the displaying of the data.
So, this service handled by a Python script airqread.py. The script is scheduled in a systemd service (systemctl airqread.service) which is set to start on boot.
My code then does the following, which is scheduled every 15 minutes using the schedule library - at 14, 29, 44 and 59 minutes past the hour (this is because there is a minute sleep before taking the air reading).
- Connects to the database, PMS7003 sensor and BME688 sensor (initialising with a stored state)
- Starts a thread to read the BME688 continuously. This continuously updates a global dictionary. Most readings are discarded but the latest one is used when writing to the database.
- Setup two schedules that run four times an hour:
- One schedule starts at 13, 28, 43 and 58 past the hour - this handles reading the PMS7003 data. At these times, the code will wait 50 seconds, wakeup the PMS7003, wait another 60 seconds, read the PMS7003 data, then sleep. This task finishes just under 10 seconds before...
- The second schedule starts at 0, 15, 30 and 45 past the hour - this writes the global dictionaries for the PMS7003 and BME688 outputs to the InfluxDB database.
The idea is I get readings every 15 minutes past the hour regularly with the correct timestamp in the database. The separate schedule for the PMS7003 ensures I read this sensor no more than the 4x the hour, as close to the database write as I dare. The BME688 is updated every few seconds however so that the BSEC library learns far more quickly from the sensor readings, but only the readings closest to the database write is actually used.
Sensor reading service - Setup
To setup the Python script for reading the sensors, first we'll need some dependencies:
sudo apt install -y python3-pip python3-influxdb python3-schedule python3-serial python3-busio python3-smbus2
You'll need a conf sub directory with your saved burn in data from above. The python file airqread.py can be in the home directory. It must be edited to put the filename of your burn-in state (edit line starting state_file_name=).
To set up a systemd service for starting the sensor read service on boot, you can use my airqread.service.
sudo cp ~/services/system/airqread.service /etc/systemd/system/
sudo systemctl daemon-reload
sudo systemctl enable airqread.service
sudo systemctl start airqread.service
sudo systemctl status airqread.service
Web Interface (Python Bottle)
Now I'm recording the results, I wanted a web interface to see them with a graph over time. Being web based is convenient as I can see the results on my Smartphone, PC or Laptop, and even away from home if I connect to my VPN.
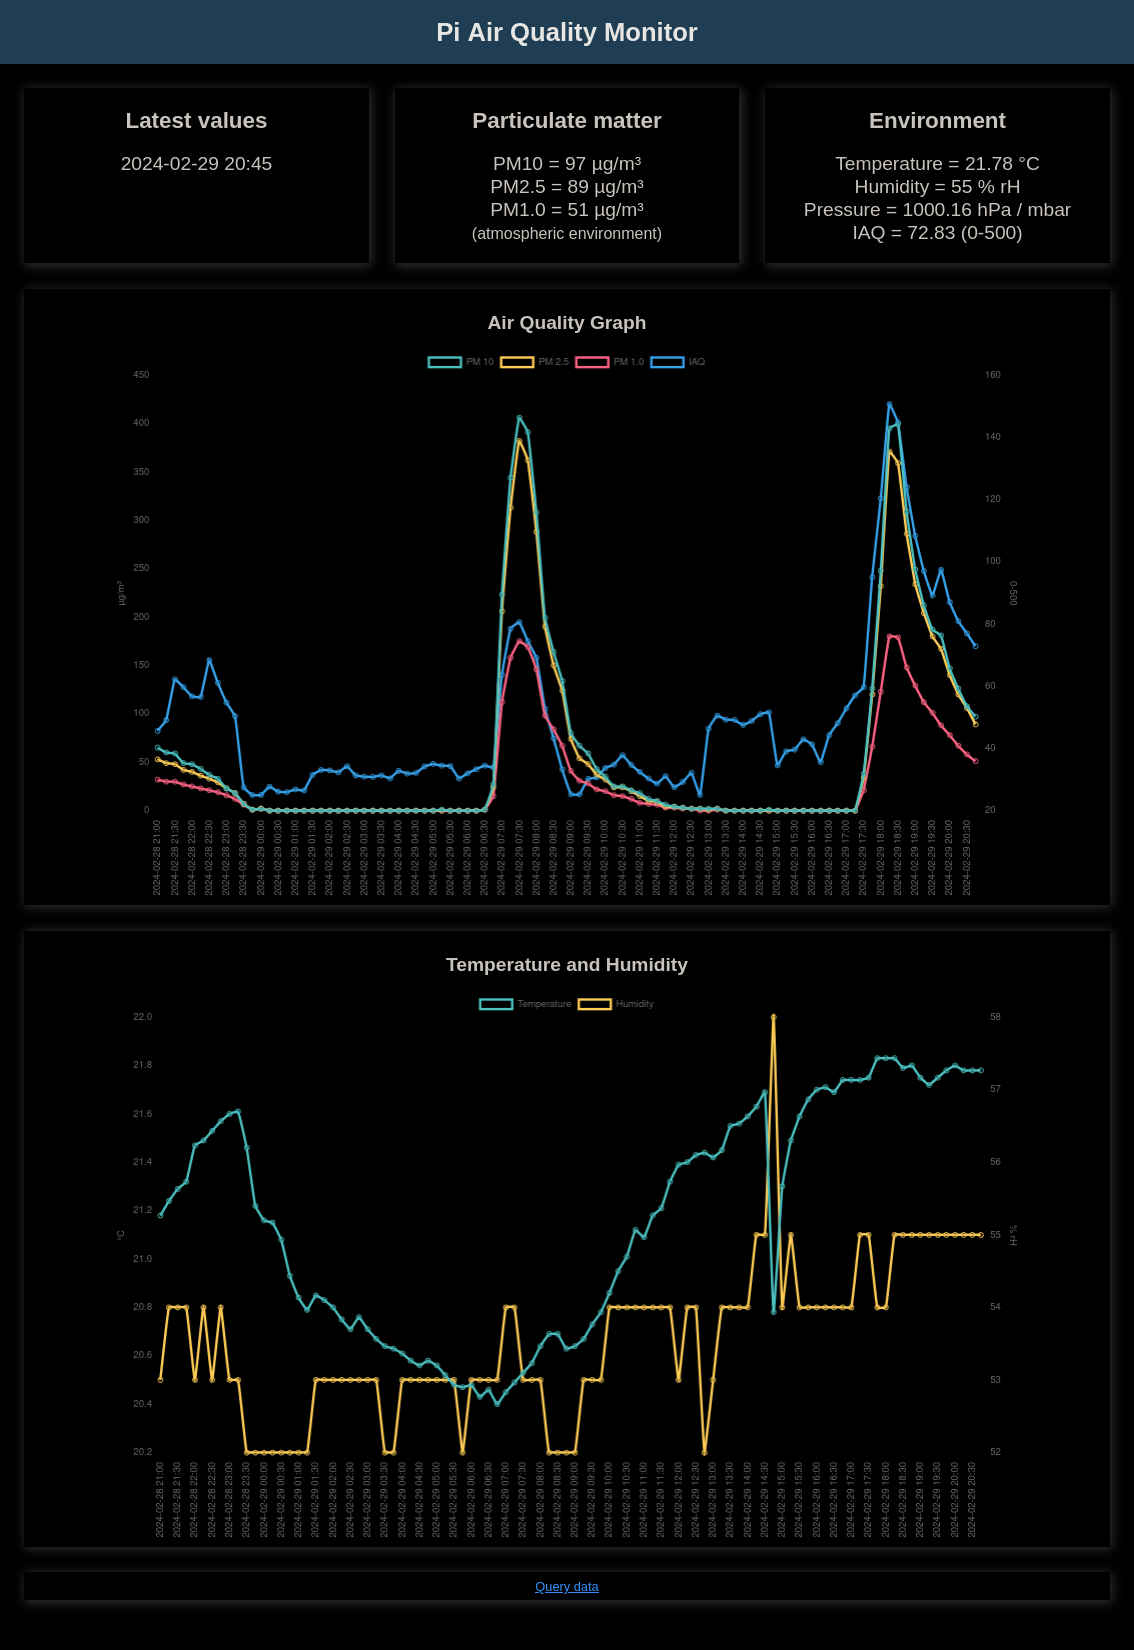
Above: Screenshot of the main interface. Latest values are displayed and two 24h graphs. You may notice the spike in PM particles and air quality - that's cooking, followed by incense, which just goes to show how easily a small two bedroom flat of my own on a cold winters day gets saturated with particles. The spike of temperature drop/humidity increase is me taking the case lid off for the above photos!
Python is used here again- airqweb.py. The Bottle Web Framework is ideal for a simple service such as this as I can have all the code simply in one file and host a lightweight web service.
It's not just Python at work here though - HTML, CSS, JavaScript (with asynchronous / json based AJAX), and a big benefit from the JavaScript based chart.js.
It's a simple web page, showing a line chart over time, and latest values at the top for an 'at a glance' check of what I'm breathing in! It is also responsive, so displays on a Smartphone or Tablet quite well.
The Python based web server starts up on port 8080 and serves the static html page airqweb.html by default. This has linked JavaScript that will post to an /action end point with json request parameters. The only action that is really implemented is query_data, which takes an optional parameter for the number of days to go back. The JavaScript hard codes one day, so the graph displays a 24 hour period.
The JavaScript then translates the data received back from python into three arrays that can be used by chart.js to display the data. It also captures the last value and updates the three span tags with the result.
The page queries the data on load, and also on focus, so if you leave the tab open it doesn't consume resources until you switch to it.
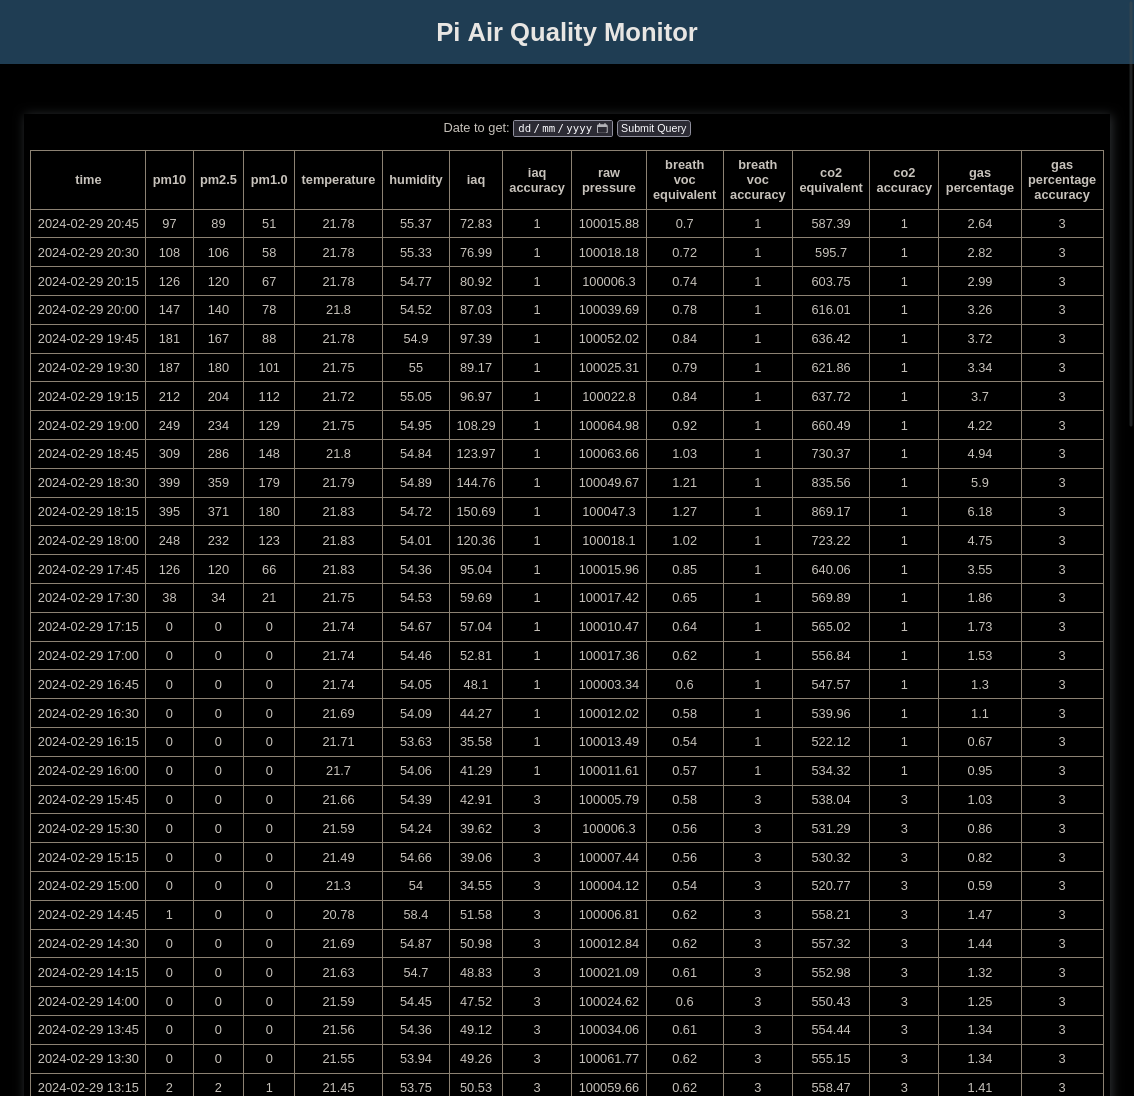
The main interface only shows PM10, PM2.5, PM1.0, Air Quality, Temperature and Humidity (and latest Air Pressure value). To see all data, I created a separate web page for this (go to http://x.x.x.x/data) which queries all columns in the database and uses JavaScript DOM to dynamically make a table to display it. It only displays one day at a time, but the html control allows any day to be picked.
I may add more functionality in time (or by kind request) as it's just software changes. If you wished, you could also install Grafana instead and get the data out of influxdb via that interface.
Web Interface - Setup
To set up, copy my files airqweb.html, airqweb.css, airqweb.js, airqweb.py and shutdown.html into your Pi's home directory.
sudo apt install -y python3-bottle
You can use my bottleweb.service to set up the web service for the camera.
sudo cp ~/services/system/bottleweb.service /etc/systemd/system/
sudo systemctl daemon-reload
sudo systemctl enable bottleweb.service
sudo systemctl start bottleweb.service
sudo systemctl status bottleweb.service
The interface should be on port 8080 (try http://x.x.x.x:8080).
Reverse Proxy (nginx)
Rather than connect directly to the Python web service on port 8080 (or start that directly on port 80), I've installed nginx to use as a reverse proxy.
NGINX is a popular web server that is extremely popular now in the corporate as well as amateur worlds, and it's light enough to work well on the Pi Zero for the couple of users who would be accessing it.
The benefit of nginx is I can password protect, SSL enable or cache or many other ideas if I want, but for now it's just a simple reverse proxy.
To set up nginx:
sudo apt install -y nginx
The nginx default configuration is in the file /etc/nginx/sites-available/default. Edit that using:
sudo nano /etc/nginx/sites-available/default
Below is an extract of the added configuration lines (including the commented out original location):
location / {
    proxy_set_header X-Real-IP $remote_addr;
    proxy_set_header X-Forwarded-For $proxy_add_x_forwarded_for;
    proxy_set_header Host $host;
    proxy_set_header X-NginX-Proxy true;
    proxy_pass http://127.0.0.1:8080/;
    proxy_redirect http://127.0.0.1:8080/ https://$server_name/;
}

#location / {
    # First attempt to serve request as file, then
    # as directory, then fall back to displaying a 404.
    #	try_files $uri $uri/ =404;
#}
Further tweaks
I've written a page of Raspberry Pi OS Tweaks that you should consider for this air quality monitoring project. Most of those tweaks have been applied to this project.
If you apply my recommendations, you'll need to go a step further with influxdb to reduce SD card writes:
sudo nano /etc/influxdb/influxdb.conf
...
  query-log-enabled = false
...
  cache-max-memory-size = "100m"
...
  cache-snapshot-memory-size = "25m"
...
  cache-snapshot-write-cold-duration = "1h"
...
[monitor]
  # Whether to record statistics internally.
  store-enabled = false
...
Then restart InfluxDB.
sudo systemctl restart influxd.service
These tweaks both reduced disk writing, but also reduced CPU usage.
Conclusion
This project was born out of having an interest in air quality and having a spare Pi Zero now unused. The Raspberry Pi and accessories are a great way that isn't too expensive to build your own projects. It's powered by USB and only needs one wire and can sit out of the way (as long as it can access the general room air).
In terms of hours of work, it's been a quick project. A few evenings here and there and a bit of weekends for the cutting/filing of the case and PCB build. I don't think there is anything commercially equivalent and it might cost more if so, so I'm pleased with the result.
References and more reading:
- World Health Organisation - Air pollution
- IQAir - What pollutants should I watch out for?
- UK DEFRA Air Pollution
- UK Gov - Particulate matter (PM10/PM2.5) Statistics
- Matt Gilpin on Medium.com - Create a Pi-powered air quality meter with PMS7003
- Leo's Notes - PMSA003A Dust Sensor
- Pimoroni - BME688 4-in-1 Air Quality Breakout
- Željko Ziriković joshefin - Measure air quality with Raspberry Pi, PMS7003 and Java
- Github.com mcalisterkm - p-sensors - Example Python code examples for the Bosch BME688/PI3G library
- PiCockpit - Teach your BME688 how to smell
- WizardTim YouTube - Teardown & Cleaning a Laser Dust Sensor PMS7003
- Never Stop Building - Micro USB pinout
- InfluxDB downloads
- Influx Data - Getting Started with Python and InfluxDB
- Chart.js - Simple yet flexible JavaScript charting library for the modern web
- PMS7003 Python code github.com - Tomasz Lewicki
- Stackoverflow.com - How can query string parameters be forwarded through a proxy_pass with nginx?
- PMS7003 datasheet
- BME688 datasheet